

A creative landing page is necessary for the success of a lead generation campaign. The landing page statistics below reveal the ingredients of a high-converting landing page and which types of pages perform best.
There are thousands of lead generation landing page examples because each business creates a customized page based on its type and goals. Which is beyond a few design and copy tweaks.
Conversion rate optimization and building a loyal customer base are the most common objectives of any sales marketing team. The below landing page statistics will give you some thoughts to put efforts in the right direction.
Top Landing Page Statistics
General Landing Page Statistics
Maximum lead generation and sales are the prime objectives of a landing page. From its copy to user experience, everything matters to increase the conversion rate. General landing page statistics will give you a collective overview of it.
- The average conversion rate of a B2B landing page is 13.28%. The same goes for 9.87% of B2C landing pages across industries. (Source: Wishpond1)
- Lead generation is the top priority of 43.6% of marketers when creating a new landing page. (Source: HubSpot2)
- Mobile landing pages with a loading time of 5 seconds or less get 70% longer average sessions after a visit. (Source: Google3)
- More than 50% of paid search clicks are directed to a landing page instead of a homepage. (Source: MECLABS4)
- A personalized landing page CTA has 202% better performance compared to the generic one. (Source: HubSpot5)
- Adding social proof on a landing page can increase the conversion rate by 34%. (Source: Unbounce6)
- 70% of brands use A/B testing to increase their landing page revenue. (Source: Adobe7)
- Every second delay in landing page loading speed reduces the conversion rate by 4.42%. (Source: Portent8)
- 88% of users don’t want to visit a page again if it has a poor user experience. (Source: 99Firms9)
- As per the research, the mean landing page submission rate is 4.14%. (Source: Unbounce10)
| Industry | Submission Rate |
|---|---|
| Media And Entertainment | 11.3% |
| Catering And Restaurants | 6% |
| Insurance And Finance | 5.8% |
| Education | 5.7% |
| Nutrition And Fitness | 4.5% |
| Legal | 4.3% |
| Leisure And Events | 4.2% |
| E-commerce | 4% |
| Travel | 3.5% |
| Business Services | 2.9% |
| Medical Services | 2.9% |
| Home Improvement | 2.5% |
| SaaS | 2.4% |
| Real Estate | 2.1% |
Landing Page Performance Statistics
The best-performing landing pages have a lower bounce rate and give maximum conversions. There is always room to improve the user experience, design, and landing page copy. However, make sure you don’t overdo things that get saturated.
Here are a few landing page performance statistics to get some ideas.
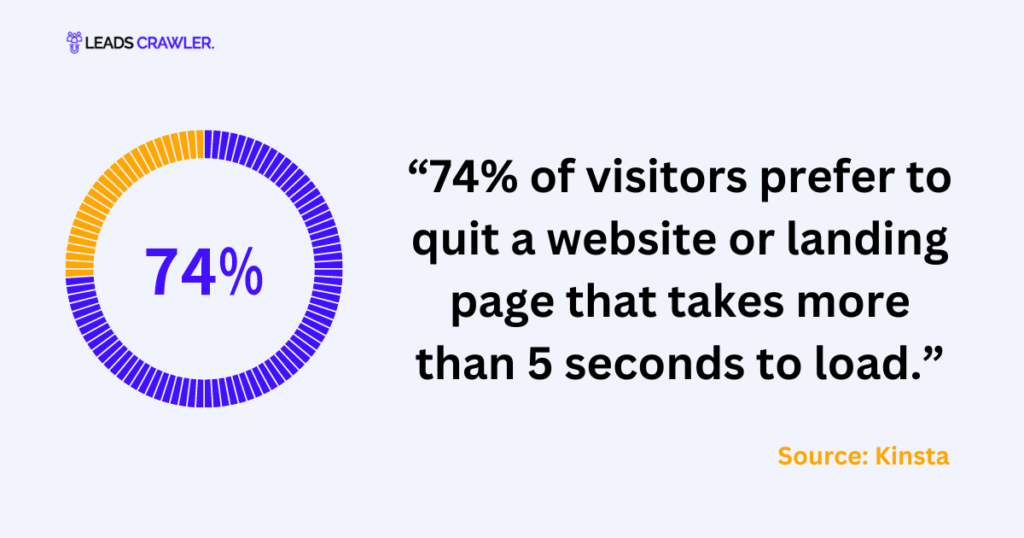
- 74% of visitors prefer to quit a website or landing page that takes more than 5 seconds to load. (Source: Kinsta12)
- More than 1/2 of mobile visitors abandon a page that takes more than 3 seconds to load. (Source: Google13)
- If there is a 100 millisecond delay in your landing page load time, it can result in a 7% decline in the conversion rate. (Source: Retail Touch Points14)
- Pages with less loading time have lower bounce rates than slow-loading pages with high bounce rates. (Source: Google)
Landing Page Conversion Rate Statistics
Conversion is the primary objective of any marketing campaign, so it is a key metric that every business tracks to measure success. A well-crafted landing page drives a high conversion rate that helps in getting more sales.
Here are a few landing page conversion statistics that will help you identify the focus points.
- Adding a video to your landing page can increase the conversion rate by 86%. (Source: Eye View)
- Embedding testimonials in a landing page can drive 34% more conversions. (Source: BigCommerce)
- Landing pages are less known types of contact form but have the highest conversion rates of 23%. (Source: Ominsend)
- Businesses that address buyers’ fears on their landing pages experience an 80% increase in conversion rate. (Source: Gripped)
- Using A/B testing on landing pages can improve conversion rate to 49%. (Source: Invesp)
- Personalized CTAs deliver two times better conversion rate compared to generic ones. (Source: HubSpot)
Landing Page Design Statistics
Search engines and user-friendly landing page design are a must for getting desired outcomes. From branding to form elements, everything needs to be well placed. Adding testimonials, social proof, and videos builds more trust.
Go through these landing page design statistics to optimize yours.
- 10.9% of marketers believe that name and email address are the only essential components of a lead gen form. (Source: HubSpot)
- Landing pages having a single CTA have a 371% higher conversion rate in comparison to those using multiple CTAs on the same page. (Source: Word Stream)
- Using a video background on the landing page increases the conversion rate by 138%. (Source: Wistia)
- On average, a landing page form consists of five fields. (Source: Databox)
- Security seals and trust badges on a landing page increase the conversion rate by 48%. (Source: Baymard Institute)
Landing Page Copy Statistics
The effectiveness of a landing page is also driven by well-written copy that converts. Use A/B testing when testing headlines and other content. Use engaging hooks that encourage visitors to make a decision.
The landing page copy statistics below will help in getting high returns.
- Landing pages with concise, skimmable copy achieve a better conversion rate. (Source: Kissmetrics)
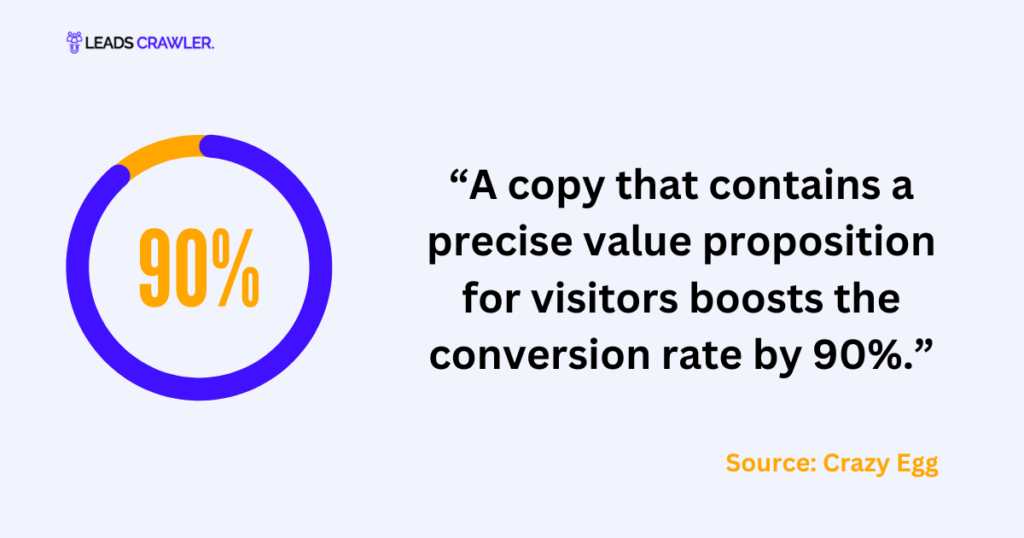
- Copy that contains a precise value proposition for visitors boosts the conversion rate by 90%. (Source: Crazy Egg)
- A sense of scarcity and urgency in the landing page copy brings better outcomes. (Source: Word Stream)
- 500 to 700 words are the ideal word count for landing pages that drive the best conversion rate. (Source: Marketing Experiments)
- Landing pages that use personalized copy aligned with user preference and behavior experience a 202% increase in their conversion rate. (Source: HubSpot)
Landing Page Strategy Statistics
A strategic marketing approach is important to consider while creating a landing page. There are thousands of successful business examples that scale with well-defined strategies. The landing page strategy statistics below will reveal it further.
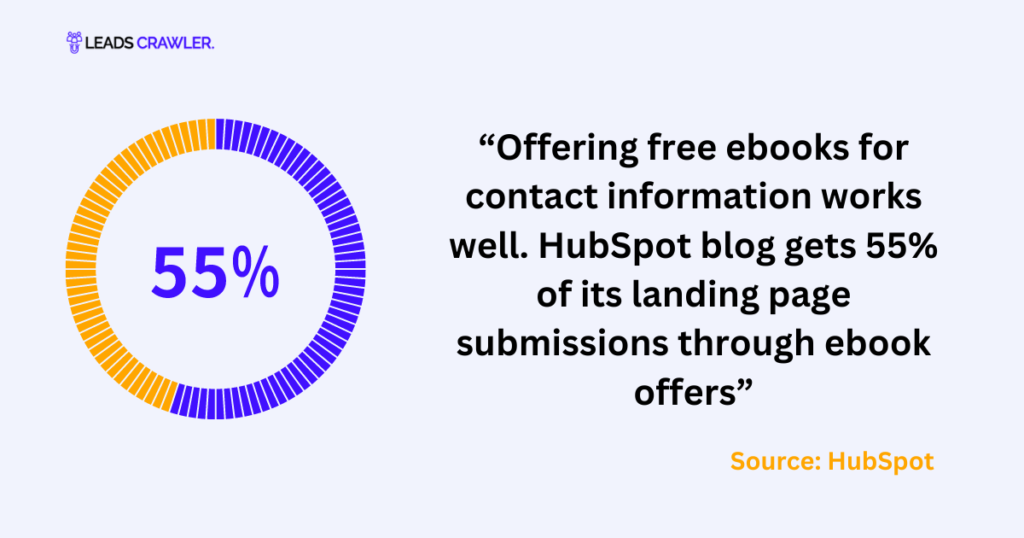
- Offering free ebooks for contact information works well. HubSpot blog gets 55% of its landing page submissions through ebook offers. (Source: HubSpot)
- Travel discount company Going experienced a 104% boost in conversions by making 3-word changes in their landing page. (Source: Unbounce)
- The use of optimization software for landing pages can lift the conversion rate by 30%. (Source: HubSpot)
- Enabling a pop-up strategy on their pricing page helped Hotjar gain 60 new trial sign-ups each month. (Source: Unbounce)
- Long-form landing pages convert 220% more leads in comparison with the short ones. (Source: Crazzy Egg)
Local Landing Page Statistics
There are different types of landing pages used to collect local leads. Their structure, content, and audience targeting are personalized as per the business goals.
Here are a few local landing page statistics you should comprehend before their implementation.
- A local landing page having multiple location-based offers has a 185% higher conversion rate. (Source: BrightLocal)
- Local landing pages having images and graphics in them get 94% more views. (Source: HubSpot)
- Nearly 76% of the top local landing pages are homepages. (Source: Nifty Marketing)
Landing Pages PPC Statistics
Pay-per-click advertising is given priority in overall marketing strategy due to its effectiveness and quick returns. Get some ideas from the insights below to optimize your campaigns for better conversion.
- Adding a video to a landing page can boost the conversion and engagement rate to 86% during PPC campaigns. (Source: Word Stream)
- PPC visitors convert 50% better than organic traffic coming from different sources. (Source: Web FX)
- Mobile PPC ads directing to a landing page have 84% more chances of getting clicked in comparison to desktop ones. (Source: Search Engine Land)
Frequently Asked Questions
What is a good landing page conversion rate?
A good conversion rate varies by industry, traffic source, offer, audience, and campaign type. Businesses should compare performance with relevant industry benchmarks.
What makes a landing page convert better?
Clear messaging, a relevant offer, strong calls to action, simple forms, fast loading times, mobile-friendly design, and trust signals can improve landing page conversions.
How can landing page performance be measured?
Key metrics include conversion rate, bounce or engagement rate, traffic sources, form submissions, click-through rate, cost per conversion, and overall conversion volume.
Why are landing page statistics important?
Landing page statistics help marketers identify conversion problems, measure campaign performance, compare results with benchmarks, and make data-driven optimization decisions.
Wrap Up
Using a landing page builder gives more control over the design and performance tracking. The above stats coming from different resources highlight their importance in a marketing strategy.
Including a free resource or incentive on the landing page as a lead magnet performs better than just pushing someone to fill out the lead form. Creative and engaging landing page copy is also a key factor in getting more conversions.
Sources List:
- Wishpond(https://blog.wishpond.com/post/113433369138/landing-page-benchmark-report-conversion-rates) ↩︎
- HubSpot(https://blog.hubspot.com/marketing/landing-page-stats) ↩︎
- Google(https://web.dev/learn/performance/why-speed-matters#bounce-rate) ↩︎
- MECLABS(https://meclabs.com/research/discovery/landing-page-optimization) ↩︎
- HubSpot(https://blog.hubspot.com/marketing/personalized-calls-to-action-convert-better-data) ↩︎
- Unbounce(https://unbounce.com/landing-page-examples/high-converting-landing-pages/) ↩︎
- Adobe(https://business.adobe.com/blog/basics/learn-about-a-b-testing) ↩︎
- Potent(https://www.portent.com/blog/analytics/research-site-speed-hurting-everyones-revenue.htm) ↩︎
- 99Firms(https://99firms.com/blog/ux-statistics/) ↩︎
- Unbounce(https://unbounce.com/conversion-benchmark-report/) ↩︎
- Wishpond (https://blog.wishpond.com/post/113433369138/landing-page-benchmark-report-conversion-rates) ↩︎
- Kinsta(https://kinsta.com/learn/page-speed/) ↩︎
- Google(https://www.thinkwithgoogle.com/consumer-insights/consumer-trends/mobile-page-speed-new-industry-benchmarks/) ↩︎
- Retail Touch Points(https://www.retailtouchpoints.com/topics/digital-commerce/milliseconds-matter-a-0-1-second-delay-can-hurt-conversions-7) ↩︎