Email is an old marketing medium businesses use to communicate with potential customers. It brings massive ROI as compared to other promotion methods. Email marketing statistics reveal its large-scale adoption and effectiveness.
Every dollar spent on email marketing brings 36 dollars in return, which is the key reason for its massive popularity. Like other channels, Its trends and strategies keep changing with time which will be evident from the below email marketing stats.
Since its beginning in the early 70s, it has been widely used by B2B and B2C businesses. In this blog, we have found some mind-blowing email marketing statistics that might help in creating impactful strategies.
Top email Marketing Statistics
General Email Marketing Statistics
Despite the growing competition with modern-day marketing approaches, it is still working in 2024. From building customer relations to nurturing potential leads, email marketing is useful in many ways. Here are a few general email marketing statistics that will help you understand much more about its existence.
- Almost 99% of email users check their email inboxes daily. (Source: HubSpot1)
- Marketers send an average of 15 emails each month. (Source: Litmus2)
- There will be 4.6 billion daily email users by the end of 2025. (Source: Statista3)
- Using spam, A/B, and QA testing before an email marketing campaign brings 28% higher returns. (Source: Litmus)
- The average email click rate is 2.62%. (Source: MailChimp4)
- Monday and Tuesday are the best days to send marketing emails. (Source: HubSpot)
- Subscriber segmentation is the most effective email marketing strategy followed by message personalization. (Source: HubSpot)
- More than 347 billion emails are exchanged every day. (Source: Statista)
- Email marketing is still the top priority of 69% of marketers for content distribution. (Source: CMI5)
- The average email open rate is 35.63%. (Source: MailChimp)
Email Usage Statistics
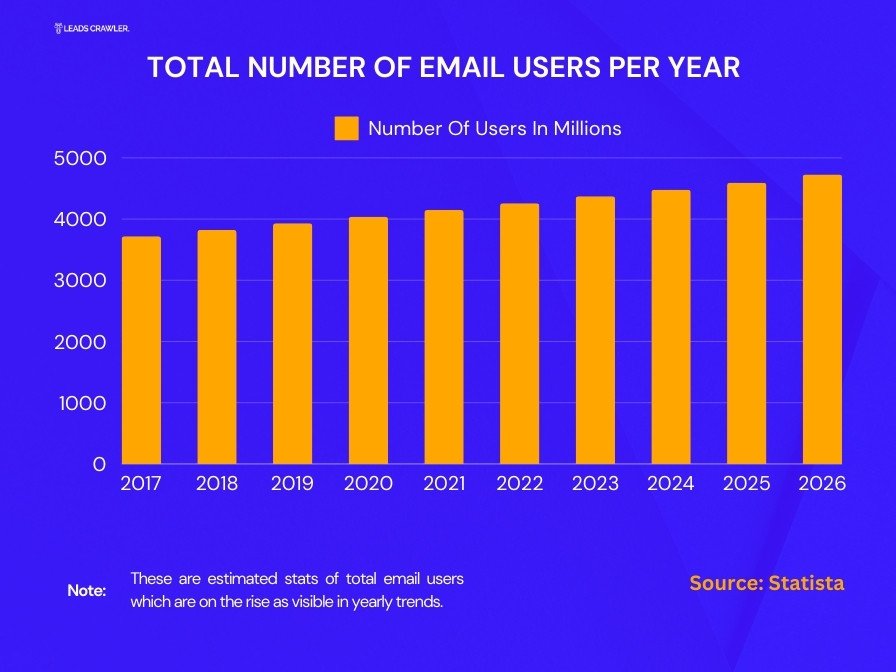
Emails have been in service for the last 5 decades and their demand is still on the rise. Despite modern-day communication advancement, they are still the favorite in terms of sales and marketing. Email usage statistics below will leave you in shock.
- The worldwide email users are expected to hit the 4.48 billion mark by the end of 2024 which is almost half of the global population. (Source: Oberlo6)
- Almost 99% of email users check their inboxes every day and 58% of them do it as their first activity in the morning. (Source: Optin Monster)
- Every email user has an average of 2 accounts and it is on the rise. Like a personal and business email account that serve two different purposes. (Source: Venngage)
- Almost 33% of worldwide emails are opened on Apple smartphones. (Source: Smart Insights)
- Professionals from across industries check their email inboxes 15 times on average every day. (Source: Fit Small Business)
Email Engagement Statistics
Business revenue growth is dependent upon the performance of email marketing campaigns and the conversions they bring. What pushes consumers to engage with promotional emails and newsletters? The email engagement statistics below will give a better understanding.
- Sharing active discount codes in the email subject line has 8 times more possibilities for conversion. (Source: Snov.io)
- Email subscribers prioritize three things while engaging with an unread email, sender name(42%), subject line(34%), and preview text(24%). (Source: Litmus)
- Senders using their photo in the email signature receive 32% more replies. (Source: Snov.io)
- 73% of marketers use only 1 or 2 CTAs in one email to improve their engagement rate. (Source: Optin Monster)
Email Marketing ROI Statistics
Incredible ROI is the key reason for its popularity among marketers. It shows a way better performance in comparison to other marketing channels including social media. The below email marketing ROI statistics will further strengthen your confidence in this claim.
- 87% of marketers are considering the increase of their email marketing budget. High ROI is the main reason behind their decision. (Source: MailModo7)
- Half of the B2B marketers in the US think email marketing is the most effective channel for revenue growth. (Source: WP Shout8)
- Personalized email marketing campaigns deliver an average of 122% ROI as compared to generic ones. (Source: Demand Sage9)
- Nearly 44% of marketers struggle while measuring email ROI and performance. (Source: Ascend2)
- Customers who receive offers through emails and purchase products spend 138% more. (Source: Digital Strike)
Email Spam Statistics
Bombarding someone’s inbox with unwanted sales pitches is unethical and would trigger them to mark it as spam. Sending the right message to the right person should be the top priority of an email marketer. Going through the below email spam statistics will further underscore the right strategies.
- The average email deliverability rate was 85.7% in 2023. (Source: Sender)
- Half of the sent emails never reach the recipient’s inbox and land in their spam folder. (Source: Statista)
- Nearly 48% of consumers don’t pay attention to brand emails. They either ignore or delete them without any sort of engagement. (Source: Air Ship)
- Russia, mainland China, and the United States are the top 3 origins of 54.53 spam emails. (Source: Securelist)
- Gmail blocks more than 100 million spam emails every day. (Source: Google)
- The demand for email security has risen from 8% to 61.3% and for email encryption, this figure is 17.9% to 41.6%. (Source: Australian Cyber Security Center)
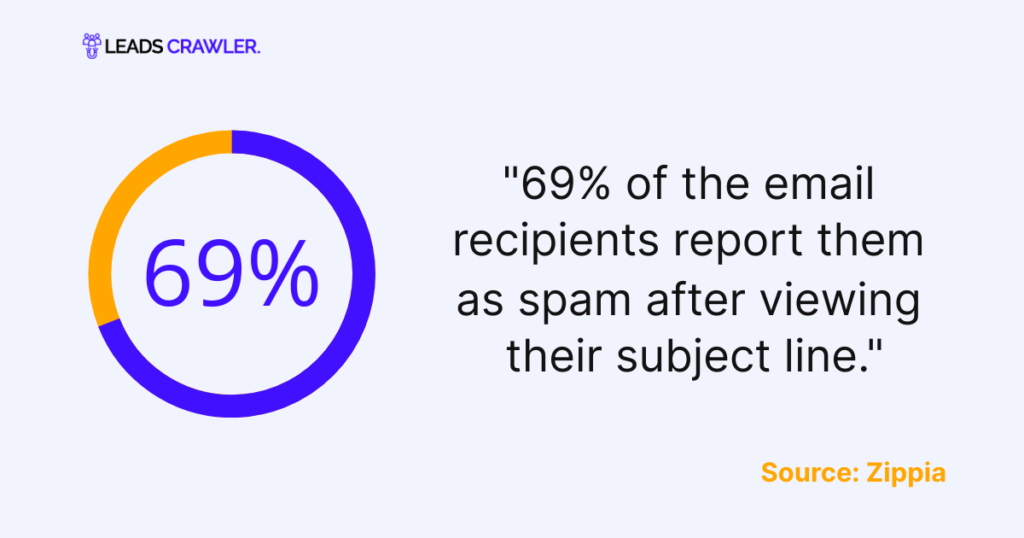
- 69% of the email recipients report them as spam after viewing their subject line. (Source: Zippia)
Mobile Email Marketing Statistics
You can’t ignore mobile marketing in this smartphone era. More people are using their mobile phones to open emails using different apps. Optimizing emails for a mobile experience is necessary to get more outcomes. The mobile email marketing statistics will further highlight its importance.
- 35% of email marketers prioritize mobile experience while designing responsive emails. (Source: Litmus)
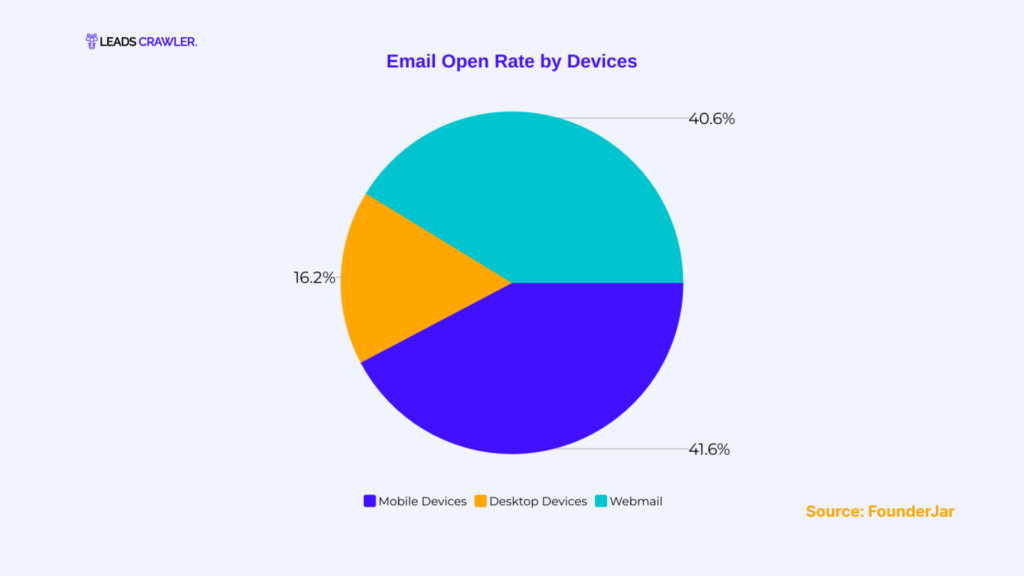
- Research reveals more than 55% of emails are opened on mobile devices. (Source: eMarketer)
- 67% of Gen Z use mobile phones to check their emails and this trend is likely to grow in coming times. (Source: Blue Core10)
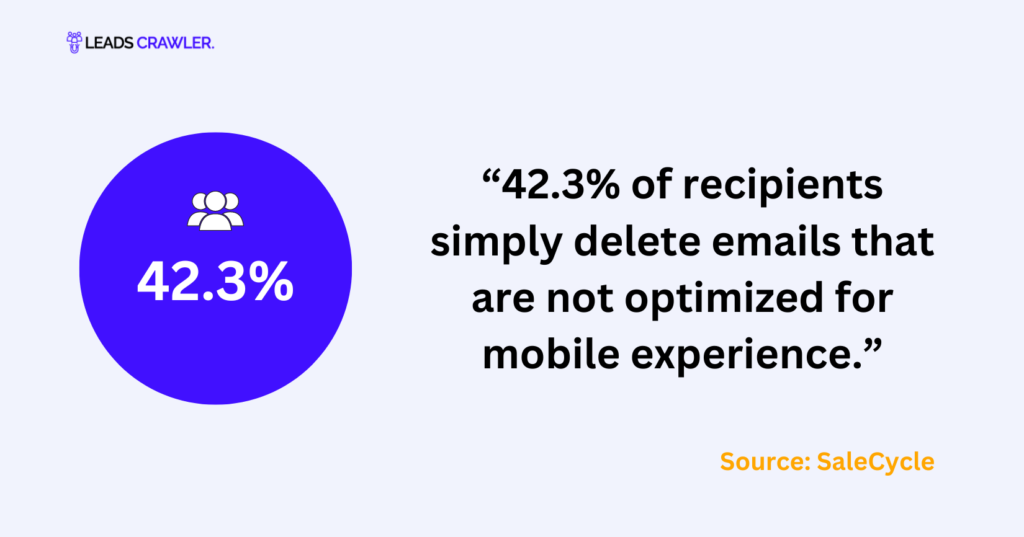
- 50% of smartphone users would send such emails into their trash if not responsive and mobile-friendly. (Source: Katey Charles)
- Mobile-optimized emails can improve the click rate by 15%. (Source: Mail Chimp)
AI In Email Marketing Statistics
The inclusion of AI in existing marketing workflow drives better results. Due to its powerful ML algorithms and data-analyzing capability marketers can improve their campaign performance. It can have several use cases including content personalization, audience segmentation, automation process, and choosing the right send time. Here are some statistics of email marketing that involve AI.
- Marketers who use AI to personalize their emails experience a 41% increase in their revenue. (Source: G2 Learning Hub)
- Almost 95% of marketers found generative AI a helpful addition to their email creation work. (Source: HubSpot)
- 75% of B2B businesses will be using both AI and traditional sales alternatives to diversify their marketing strategies. (Source: BusinessDIT11)
- Email retargeting(55%), content personalization (53%), and subject line optimization (44%) are the 3 most used cases of AI in email marketing. (Source: Ascend2)
- A survey of industry leaders and marketers found positive feedback from 58.3% of respondents for adding AI to improve email newsletters. (Source: Selzy12)
Email Personalization Statistics
Generic emails have a low open rate and click rate. Consumers also prefer interacting with personalized emails. Following email personalization statistics will help you create engaging email content considering their pain points and enhanced performance.
- Personalized emails have 6 times better chances of conversion than generic ones. (Source: MailModo)
- 88% of consumers surveyed liked personally written emails and showed their will to make purchases. (Source: Benchmark Email13)
- Businesses using dynamic content in their emails experience a 22% increase in their ROI. (Source: Litmus)
- 59% of marketers cite personalization as key to boosting email engagement. (Source: Mailjet)
- Surprisingly 53% of consumers feel pleased to receive emails with birthday and anniversary mentions. (Source: Gartner)
Also Read: How To End An Email?
Email Timings and Frequency Statistics
No one checks their inbox on weekends and their off time. Recipients also hate repeated follow-ups by crowding their mailboxes. So picking the right email timing and frequency is important which will be further highlighted in the below statistics.
- 50% of marketers believe that there is no ideal time for sending emails due to the originality of every business and person. (Source: Data Box)
- Thursday(18%) is the most favored day for marketers to send emails followed by Tuesday(17%) and Wednesday(16%). (Source: Mail Chimp)
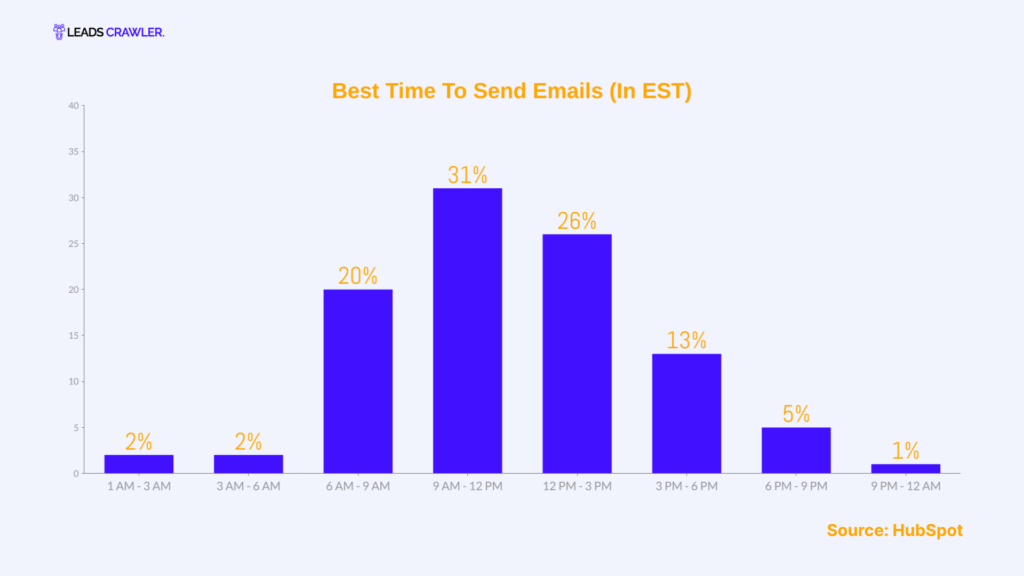
- 9 AM to 12 PM is the perfect time to send B2B and B2C emails. (Source: HubSpot)
- Saturday is the worst weekday to trigger an email campaign. (Source: Moosend)
- 61% of the newsletter subscribers or customers are comfortable with weekly promotional emails. (Source: Marketing Sherpa)
- Sending numerous emails is one of the three biggest reasons for people to unsubscribe (53.5%) followed by repeated(46.5%), and misleading emails(30.4%). (Source: Gartner)
B2C Email Marketing Statistics
B2C and e-commerce businesses can also use email marketing to build a loyal customer base. It can help increase customer engagement and retention. The B2C email marketing statistics below will further reveal its significance.
- Abandonment cart email campaigns have almost a 50% open rate and generate an average revenue of $3.58 per shopper. (Source: Klaviyo14)
- 51% of online shoppers in the US prefer email marketing channels to receive discount offers. (Source: eMarketer)
- Almost 21% of emails are opened within an hour of being sent by marketers. (Source: Get Response)
- 87% of B2C marketers use automation as a key component in their email marketing strategy. (Source: HubSpot)
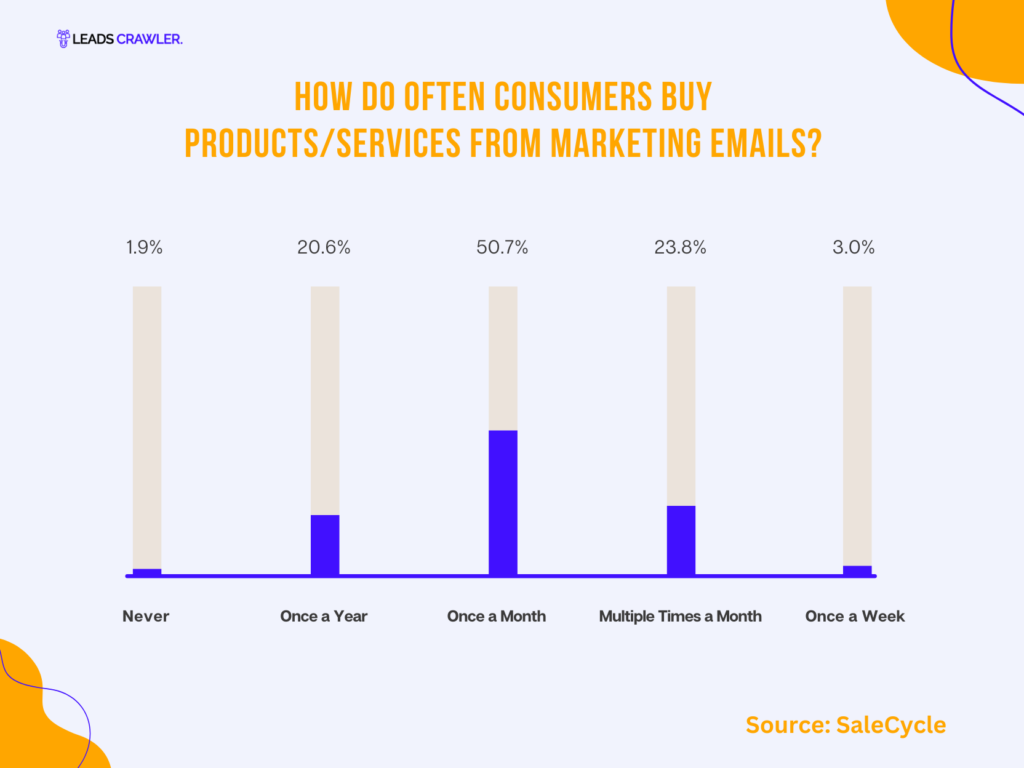
- A recent survey reveals only 50% of the recipients buy products from marketing emails once a month. (Source: SalesCycle)
- 59% of the respondents confirmed the influence of marketing emails on their purchase decisions. (Source: SalesCycle)
Email Advertising Statistics
Email advertising is a well-known marketing approach to approach consumers for commercial objectives. With a targeted and personalized approach, it yields a high amount of returns. Product announcements, newsletters, and promotional campaigns are some most used strategies. Email advertising statistics below are its glimpse.
- Emails having a single CTA in them secure 371% more clicks and increase the chances of a sale by 1617%. (Source: Word Stream)
- Almost half of marketers use trigger-based emails for their marketing campaigns. (Source: Snov.io)
- 91% of consumers expect interactive content from marketers but only 17% of them accomplish it. (Source: Litmus)
- Adding a video to an email can boost its CTR by 300%. (Source: Biteable)
- Email subject lines consisting of 6 to 10 words achieve the highest open rate of 21%. (Source: Snov.io)
- Email open rate (31%) and clickthrough rate are the two most tracked metrics by marketers. (Source: HubSpot)
B2B Email Marketing Statistics
B2B businesses adopt multi-channel marketing strategies and email marketing is one absolute part of it. Customers in the B2B category have a longer sales cycle, due to the involvement of multiple decision-makers in the process. The B2B email marketing statistics shared below will further surprise you.
- More than 81% of B2B marketers use email newsletters to market their content. (Source: CMI)
- Welcome, and new product announcements related B2B emails have higher open rates. (Source: HubSpot)
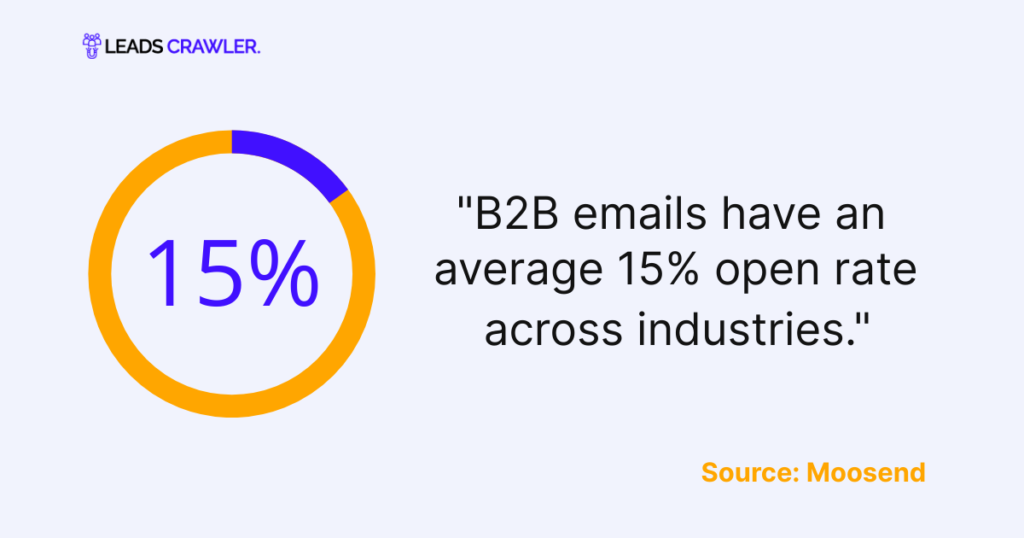
- B2B emails have an average 15% open rate across industries. (Source: Moosend)
- 67% of B2B customers receive an overwhelming amount of unwanted and spam emails so they use a separate junk email account to get away from them. (Source: Gartner)
- B2B marketers consider email marketing as the second most important method to generate qualified leads for their business. (Source: Sage Frog15)
- 83% of B2B marketers in the US consider email engagement as a measuring metric of their content performance. (Source: eMarketer)
Email Subject Line Statistics (Open Rate)
The email subject line works as a hook and an important factor behind the open rate. A creative subject line can include incredible news, updated stat, and a personalized phrase. Here are some email subject line statistics and their connection with email open rates.
- Welcome emails have the highest open rate of 63.91%. (Source: Get Response)
- Best-performing emails have an average of 43.85 characters in the subject line. (Source: AWeber)
- Emails that include the word “video” in their subject line get a 19% higher open rate and 65% clickthrough rate. (Source: Moosend)
- 47% of the email recipients are influenced by the email subject line which leads to opening. (Source: Zippia16)
- Marketers who use interactive email subject lines get a 70% higher conversion rate. (Source: Finances Online)
Email Marketing Effectiveness Statistics
Triggering dozens of emails without any personalization won’t work. The performance of your email marketing campaign is directly linked to its effectiveness. So here we go with some email marketing effectiveness statistics that every marketer should understand.
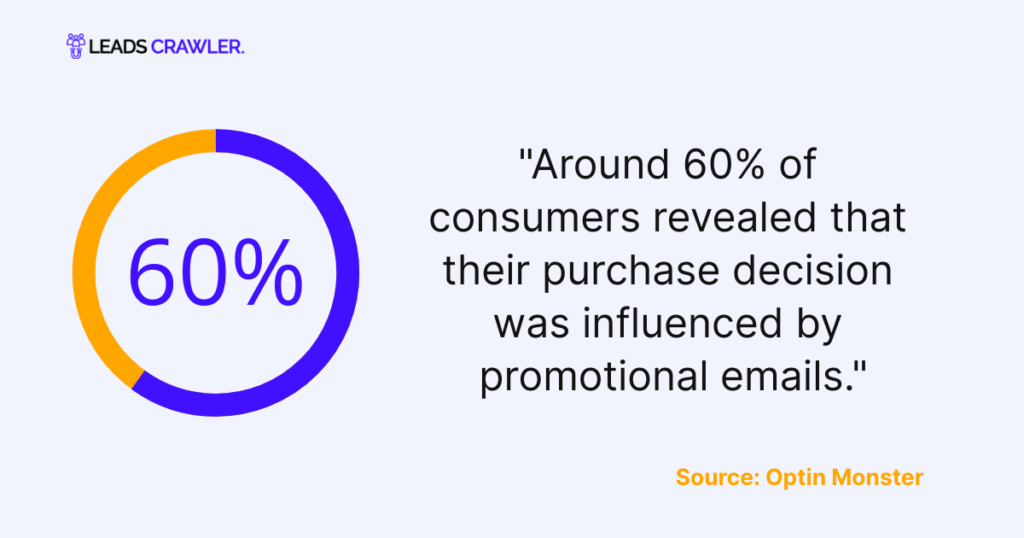
- Almost 60% of consumers revealed that their purchase was influenced by promotional emails. (Source: Optin Monster)
- Emails having creative images in their design get a 10% boost in their open rate. (Source: HubSpot)
- Personalizing marketing emails can lead to a 760% boost in company revenue. (Source: Techjury17)
- More than half of the marketing fraternity endorse segmentation as the most effective email marketing strategy. (Source: Insta Page)
Frequently Asked Questions
Wrap Up
Email marketing is an important pillar of multi-channel strategies. It helps businesses in building meaningful relationships with their customers and collects their feedback.
The right use of automation in personalization and data analysis gives the upper hand over the competitors. Latest email privacy regulations are the biggest challenge for marketers that demand only reasonable communication.
Sources list:
- HubSpot(https://blog.hubspot.com/marketing/email-marketing-stats) ↩︎
- Litmus(https://www.litmus.com/resources/state-of-email-workflows) ↩︎
- Statista(https://www.statista.com/statistics/255080/number-of-e-mail-users-worldwide/) ↩︎
- MailChimp(https://mailchimp.com/resources/email-marketing-benchmarks/) ↩︎
- CMI(https://contentmarketinginstitute.com/wp-content/uploads/2022/10/b2b-2023-research-final.pdf) ↩︎
- Oberlo(https://www.oberlo.com/statistics/how-many-people-use-email) ↩︎
- MailModo(https://www.mailmodo.com/guides/email-marketing-roi-statistics/) ↩︎
- WPShout(https://wpshout.com/email-marketing-statistics/) ↩︎
- DemandSage(https://www.demandsage.com/email-marketing-statistics/) ↩︎
- BlueCore(https://www.bluecore.com/blog/how-millennials-use-email/) ↩︎
- BusinessDIT(https://www.businessdit.com/ai-marketing-statistics/) ↩︎
- Selzy(https://selzy.com/en/benchmarks/ai-email-marketing-statistics/) ↩︎
- Benchmark Email(https://www.benchmarkemail.com/blog/email-marketing-stats/) ↩︎
- Klaviyo(https://www.klaviyo.com/marketing-resources/email-benchmarks-by-industry) ↩︎
- SageFrog(https://www.sagefrog.com/wp-content/uploads/2023/11/Sagefrog_2024-B2B-Marketing-Mix-Report.pdf) ↩︎
- Zippia(https://www.zippia.com/advice/email-subject-line-statistics/) ↩︎
- Techjury(https://techjury.net/blog/email-marketing-stats/) ↩︎